Compendium: Adding eBPF for Kernel-Level Visibility
This is a follow-up to Compendium: A Linux Syscall Tracer.
github.com/louisboilard/compendium
Introduction
In the first article, we covered how Compendium uses ptrace to intercept syscalls, track file descriptors, monitor memory, and produce interactive reports. That works well for understanding what a program asks the kernel to do. But there's a whole class of information ptrace an't access: what happens inside the kernel after the syscall is made.
For example, when a program calls write(),
ptrace can tell you the syscall happened and how many bytes were
written. But it can't tell you how long the block device took to
actually complete that I/O. When your program is runnable but
waiting for CPU time, ptrace has no idea. It only sees
the process when it's actively making syscalls. Instead of
intercepting syscalls and examining the state of our userspace runtime at that
point, it would be amazing if there was something we could use to observe
what's happening (certain events) from the kernel's perspective as things
happen. If only something existed..
Enter eBPF. By attaching small programs to kernel tracepoints, we can now measure scheduler latency (how long a process waits for CPU time after being woken) and block I/O latency (how long disk operations actually take at the device level). These are kernel-internal events that we can't access with the ptrace mechanism, and they fill in the gaps that our syscall-level view was missing!
You enable it with --ebpf:
compendium --ebpf --report trace.html -- dd if=/dev/zero of=/tmp/test bs=1M count=500 oflag=direct
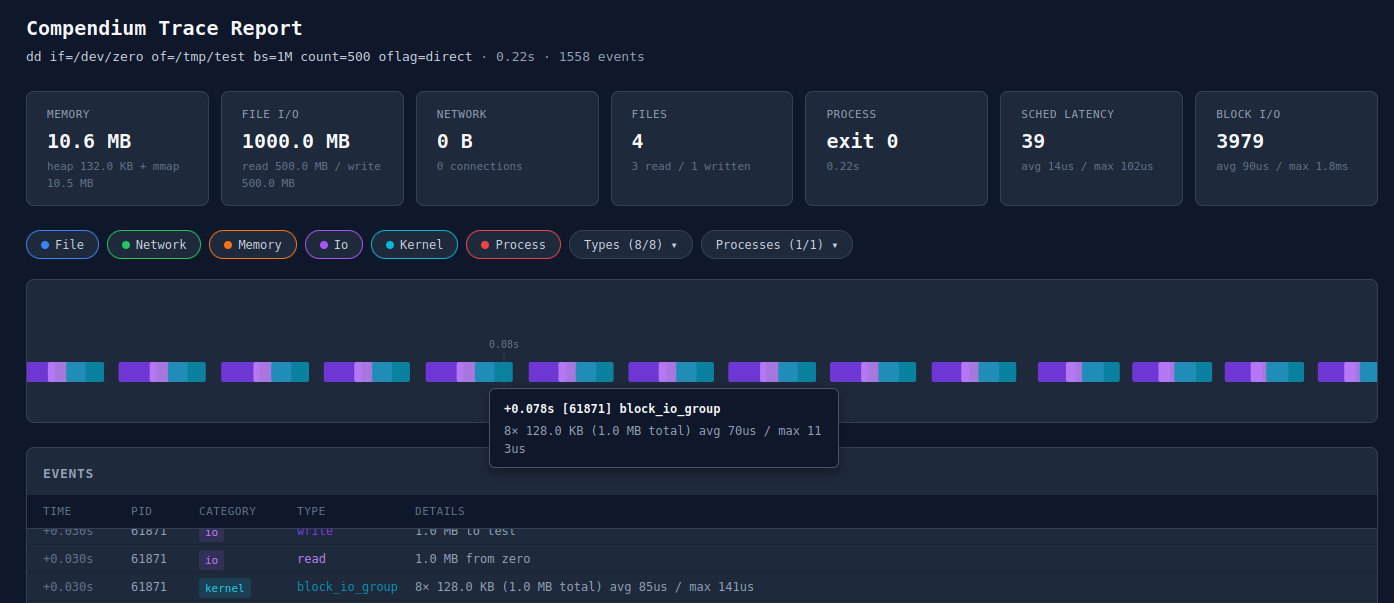
Report with eBPF enabled: new "Sched Latency" and "Block I/O" summary cards, kernel events on the timeline
The report now includes two new summary cards (scheduler latency and block I/O), a "Kernel" category filter, and kernel events rendered in cyan on the timeline alongside the existing ptrace events.
Why eBPF? What Ptrace Can't See
With Ptrace we had syscall boundary information. It intercepts your program at syscall-enter and syscall-exit, which gives us argument values, return codes, and timing between the two. This is great for building a picture of what the program does in terms of I/O, memory, and network activity. But there are important things happening inside the kernel that we were blind to:
Scheduler latency: After your process is woken up (e.g., an I/O completes, a futex is released, a signal arrives), it doesn't run immediately. It goes into the run queue and waits for the scheduler to actually give it a CPU core. On a busy system, this delay can be significant. Ptrace doesn't see this at all. From ptrace's perspective, the process was just "stopped" and then "running" again. The gap between wakeup and actually getting scheduled is invisible, and can be useful to know!
Block I/O latency: When a program does a direct I/O write,
ptrace sees the write syscall and its return value.
But the actual time spent waiting for the block device (SSD, NVMe,
...) is buried inside the kernel's block layer. For
buffered I/O the kernel might return from the syscall before the
data even hits the device. For direct I/O the syscall blocks, but
ptrace can't distinguish "blocked on disk" from "blocked on
anything else".
eBPF lets us attach programs to kernel tracepoints. These are stable instrumentation points that the kernel exposes for exactly this kind of observability. Our programs run in the kernel context with near-zero overhead, can access kernel data structures, and send events back to userspace via a ring buffer. Critically, the BPF verifier ensures our programs are safe: they can't crash the kernel, loop forever, or access memory they shouldn't.
Scheduler Latency Tracking
The strategy for measuring scheduler delay is straightforward: record a timestamp when a process is woken up, then compute the delta when it actually gets scheduled on a CPU.
We attach to two tracepoints: sched/sched_wakeup and
sched/sched_switch. The first fires when the kernel
marks a task as runnable. The second fires when the scheduler
context-switches to a new task.
Process timeline:
                                              sched_switch
  sleeping ──────► wakeup ──────────────────► (now running)
                     │                             │
                     └── sched_wakeup fires        └── record delay = now - wakeup_ts
                         store timestamp
                         in BPF hash map
The wakeup handler checks if the PID is one we're tracking (more on PID filtering in a moment), and if so, stores the current kernel timestamp in a BPF hash map keyed by PID:
SEC("tp/sched/sched_wakeup")
int handle_sched_wakeup(struct trace_event_raw_sched_wakeup_template *ctx)
{
    __u32 pid = ctx->pid;
    __u8 *tracked = bpf_map_lookup_elem(&TRACKED_PIDS, &pid);
    if (!tracked)
        return 0;

    __u64 ts = bpf_ktime_get_ns();
    bpf_map_update_elem(&WAKEUP_TS, &pid, &ts, BPF_ANY);
    return 0;
}
The switch handler looks up the incoming PID in that map, computes
the delta, and if it exceeds 10 microseconds, reserves space in
the ring buffer and submits an event. Below 10 microseconds is
normal scheduling jitter and not worth reporting. If the ring
buffer is full, a dropped_events counter is
incremented so we can surface losses in the summary:
SEC("tp/sched/sched_switch")
int handle_sched_switch(struct trace_event_raw_sched_switch *ctx)
{
    __u32 next_pid = ctx->next_pid;

    __u64 *wakeup_ts = bpf_map_lookup_elem(&WAKEUP_TS, &next_pid);
    if (!wakeup_ts)
        return 0;

    __u64 now = bpf_ktime_get_ns();
    __u64 delay = now - *wakeup_ts;
    bpf_map_delete_elem(&WAKEUP_TS, &next_pid);

    if (delay < MIN_SCHED_DELAY_NS)
        return 0;

    struct sched_delay_event *evt =
        bpf_ringbuf_reserve(&EVENTS, sizeof(*evt), 0);
    if (!evt) {
        __sync_fetch_and_add(&dropped_events, 1);
        return 0;
    }

    evt->event_type = EVENT_SCHED_DELAY;
    evt->pid = next_pid;
    evt->delay_ns = delay;
    evt->timestamp_ns = now;
    bpf_ringbuf_submit(evt, 0);
    return 0;
}
A process waiting 500 microseconds for CPU time after a wakeup could mean the system is under CPU pressure, or that the scheduler's load balancing is suboptimal for the workload. These are the kinds of things that are nearly impossible to diagnose with syscall-level tracing alone. You'd see the symptom (a syscall taking longer than expected) but not the cause (the process wasn't even running).
Block I/O Latency Tracking
Block I/O tracking follows a similar paired-event strategy.
We attach to block/block_rq_issue (when the kernel
submits a request to the block device driver) and
block/block_rq_complete (when the device signals
completion).
I/O request lifecycle:

  write() syscall ──► block layer ──► block_rq_issue ──► device ──► block_rq_complete
                                        │                              │
                                        └── store (dev, sector)        └── latency = now - issue_ts
                                            as key + timestamp             emit event
                                            in INFLIGHT_IO map
The key here is that we use the (device, sector) pair
to correlate issue and completion events. When a request is issued,
we store the timestamp, TID, and byte count in a hash map keyed by
device and sector. When that request completes, we look it up,
compute the latency, and emit the event:
SEC("tp/block/block_rq_issue")
int handle_block_rq_issue(struct trace_event_raw_block_rq *ctx)
{
    __u32 pid = (__u32)(bpf_get_current_pid_tgid() & 0xFFFFFFFF);
    __u8 *tracked = bpf_map_lookup_elem(&TRACKED_PIDS, &pid);
    if (!tracked)
        return 0;

    struct io_key key = {};
    key.dev = ctx->dev;
    key.sector = ctx->sector;

    struct issue_info info = {};
    info.ts = bpf_ktime_get_ns();
    info.pid = pid;
    info.bytes = ctx->nr_sector * 512ULL;

    bpf_map_update_elem(&INFLIGHT_IO, &key, &info, BPF_ANY);
    return 0;
}
An important design choice: we only track direct/synchronous I/O.
The issue handler checks the current TID against our tracked PID
set (we use the lower 32 bits of bpf_get_current_pid_tgid(),
which is the thread ID, matching what the scheduler tracepoints
use). For buffered writes, the kernel's writeback threads
(kworker) are the ones that actually submit block
requests, so they won't match our PID filter. This is intentional:
buffered writeback is asynchronous and decoupled from the
application. It is not useful to attribute that latency to the
traced process.
In non-verbose mode, consecutive block I/O events from the same PID with the same operation size are grouped. Instead of printing 500 repetitive/individual lines, you get a collapsed summary:
[+0.078s] [61871] block I/O 5.2ms avg, 8.1ms max (4.0 KB x12, 48.0 KB total)
This grouping persists across poll iterations. The group is flushed when the PID or operation size changes, or when a scheduler delay event arrives (since those represent a different kind of activity).
The C-Rust FFI Strategy
eBPF programs must be written in C (or a restricted subset of it) and compiled to BPF bytecode. The question is how to bridge the two without introducing build complexity or runtime dependencies.
There are crates like aya that let you write BPF
programs in Rust, but we went with the
straightforward approach: write the BPF programs in C, compile them
once with clang to a .o object file, check
that object file into the repository, and embed it in the Rust
binary at compile time with include_bytes!.
Build pipeline:

  [Rare / manual step]
  compendium.bpf.c ──clang──► compendium.bpf.o  (checked into git)

  [Every cargo build]
  compendium.bpf.o ──include_bytes!()──► embedded in Rust binary
                                         loaded at runtime via libbpf-rs
The .o file is compiled ahead of time and committed to
the repo. The compilation step only needs to happen when the BPF C
code changes, which is rare. This means cargo build
works without needing clang, bpftool, or any BPF toolchain
installed. The BPF object is just bytes baked into the binary.
This was simpler for our use case.
let obj_bytes = include_bytes!("../bpf/compendium.bpf.o");

let open_obj = ObjectBuilder::default()
    .open_memory(obj_bytes)
    .context("Failed to open BPF object")?;

let obj = open_obj.load().context("Failed to load BPF object")?;
At runtime, libbpf-rs (the Rust bindings for libbpf)
loads the object, relocates it, and sends it to the kernel's BPF
verifier. This is the same path that libbpf-based C tools use. The
verifier checks that the programs are safe, the maps are correctly
typed, and the tracepoint attachments are valid. Then we attach
and we're live.
For the data structures shared between the C BPF programs and
Rust userspace, we use #[repr(C)] structs with explicit
padding to match the C layout:
// C side (BPF program):
// struct sched_delay_event {
//     __u8  event_type;
//     __u8  _pad[3];
//     __u32 pid;
//     __u64 delay_ns;
//     __u64 timestamp_ns;
// };

// Rust side (userspace):
#[repr(C)]
struct SchedDelayEvent {
    event_type: u8,
    _pad: [u8; 3],
    pid: u32,
    delay_ns: u64,
    timestamp_ns: u64,
}
The event type byte at offset 0 acts as a discriminant. The ring buffer callback reads the first byte, checks whether it's a scheduler delay or block I/O event, and casts accordingly:
const EVENT_SCHED_DELAY: u8 = 1;
const EVENT_BLOCK_IO: u8 = 2;

// In the ring buffer callback:
match data[0] {
    EVENT_SCHED_DELAY if data.len() >= size_of::<SchedDelayEvent>() => {
        let evt: SchedDelayEvent =
            unsafe { std::ptr::read_unaligned(data.as_ptr() as *const _) };
        pending.borrow_mut().push(EbpfEvent::SchedDelay(evt));
    }
    EVENT_BLOCK_IO if data.len() >= size_of::<BlockIoEvent>() => {
        let evt: BlockIoEvent =
            unsafe { std::ptr::read_unaligned(data.as_ptr() as *const _) };
        pending.borrow_mut().push(EbpfEvent::BlockIo(evt));
    }
    _ => {}
}
The _pad field ensures pid sits at a
4-byte aligned offset, matching what the C compiler produces. This
is the kind of thing that silently breaks if you get it wrong, so
having the C and Rust struct definitions side by side is helpful.
We use read_unaligned because the ring buffer data
pointer has no alignment guarantees.
All of this is wrapped in an EbpfTracker struct that
owns the BPF object, links, ring buffer, and PID filter map:
pub(crate) struct EbpfTracker {
    _links: Vec<Link>,
    ring_buf: RingBuffer<'static>,
    tracked_pids: MapHandle,
    bss: Option<MapHandle>,
    pending: Rc<RefCell<Vec<EbpfEvent>>>,
    _object: &'static mut libbpf_rs::Object,
}
We leak the BPF object to 'static lifetime via
Box::leak. The ring buffer callback requires
'static references, and the maps and programs reference
the object and need to live for the entire trace session. Since
compendium runs until the traced process exits (and then
terminates itself), leaking is actually fine, we just let the OS
clean up.
The alternative (unsafe self-referential struct or Pin trickery)
would add complexity for no practical benefit.
The bss handle lets us read the
dropped_events counter from the BPF program's
global data at the end of tracing, so we can report if any events
were lost.
Fitting Into the Event Loop
The original compendium event loop uses poll() to
multiplex between a signalfd (for ptrace
SIGCHLD notifications) and a perf event fd (for page
faults). Adding eBPF means adding a third fd to the poll set:
the ring buffer's epoll fd.
poll() multiplexing:

  ┌─────────────┐
  │  signalfd   │──► ptrace events (syscalls, fork, exit)
  ├─────────────┤
  │  perf fd    │──► page fault samples
  ├─────────────┤
  │  ebpf fd    │──► scheduler delays, block I/O latency
  └─────────────┘
The eBPF ring buffer fd is added to the poll set alongside the existing fds:
let ebpf_poll_idx = if self.ebpf_tracker.is_some() {
    let idx = poll_fds.len();
    poll_fds.push(libc::pollfd {
        fd: self.ebpf_tracker.as_ref().unwrap().poll_fd(),
        events: libc::POLLIN,
        revents: 0,
    });
    Some(idx)
} else {
    None
};
The ordering matters. eBPF events are drained first in each loop iteration, because they carry kernel timestamps that are always earlier than the wall-clock time at which we process ptrace events. This ensures that when we interleave events for the report, the chronological ordering is correct.
The PID filter map is kept in sync with ptrace's process tracking.
When ptrace detects a fork(), vfork(), or
clone(), we add the new PID to the BPF hash map. When a
process exits, we remove it:
// On fork/clone — keep kernel and userspace PID sets in sync
if let Some(ref ebpf) = self.ebpf_tracker {
    ebpf.add_pid(new_pid.as_raw() as u32);
}

// On exit
if let Some(ref ebpf) = self.ebpf_tracker {
    ebpf.remove_pid(pid.as_raw() as u32);
}
This way the BPF programs only generate events for the process tree we're actually tracing, and not for every process on the system.
One subtlety: timestamps. BPF programs use
bpf_ktime_get_ns(), which reads
CLOCK_MONOTONIC. Compendium's ptrace side uses
Instant::now(), which on Linux is also
CLOCK_MONOTONIC. We sample the clock at tracer startup
and use that as a baseline, so both BPF and ptrace timestamps can be
expressed as seconds elapsed since the trace started:
// Sample CLOCK_MONOTONIC (same clock as bpf_ktime_get_ns)
// alongside start_time so we can convert kernel timestamps
// to tracer-relative seconds.
self.ktime_base_ns = {
    let mut ts = libc::timespec { tv_sec: 0, tv_nsec: 0 };
    unsafe { libc::clock_gettime(libc::CLOCK_MONOTONIC, &mut ts) };
    ts.tv_sec as u64 * 1_000_000_000 + ts.tv_nsec as u64
};

/// Convert a kernel bpf_ktime_get_ns() timestamp to tracer-relative seconds.
fn ktime_to_secs(&self, ktime_ns: u64) -> f64 {
    ktime_ns.saturating_sub(self.ktime_base_ns) as f64 / 1_000_000_000.0
}
This is what lets the report timeline place kernel events and
syscall events on the same axis. The new fields on the
Tracer struct for all of this are:
pub(crate) struct Tracer {
    // ... existing fields: config, processes, memory, io, perf ...
    pub(crate) ebpf_tracker: Option<ebpf::EbpfTracker>,
    pub(crate) ebpf_stats: EbpfStats,
    pub(crate) pending_block_io: Option<PendingBlockIoGroup>,
    pub(crate) ktime_base_ns: u64,
    // ...
}

pub(crate) struct EbpfStats {
    pub(crate) enabled: bool,
    pub(crate) sched_delays: u64,
    pub(crate) total_sched_delay_ns: u64,
    pub(crate) max_sched_delay_ns: u64,
    pub(crate) block_io_ops: u64,
    pub(crate) total_block_io_ns: u64,
    pub(crate) max_block_io_ns: u64,
    pub(crate) dropped_events: u64,
}
Ptrace + eBPF: Complementary tools!
We're not replacing
ptrace with eBPF. eBPF could theoretically trace syscalls too
(via raw_syscalls/sys_enter and
raw_syscalls/sys_exit tracepoints), but ptrace gives us
something eBPF can't easily replicate: the ability to read arbitrary
memory from the traced process.
When ptrace intercepts an open() syscall, we read the
path string from the tracee's memory using
process_vm_readv. When we see a connect(),
we read the sockaddr struct to extract the IP address
and port. When we see a write(), we can peek at the
buffer contents. BPF programs can read kernel memory via helpers,
but reading userspace memory from BPF context is more constrained
and fragile (via bpf_probe_read_user), especially for
variable-length strings.
Ptrace also gives us precise control flow: we stop the process at every syscall entry and exit, which lets us maintain stateful tracking (fd tables, memory maps, brk position). BPF programs are stateless per invocation. You can use maps for state, but the programming model is fundamentally different.
So the division of labor is clean:
ptrace:  syscall arguments, return values, fd tracking, memory tracking
         → what the program asks the kernel to do

eBPF:    scheduler delays, block I/O latency
         → what the kernel does behind the scenes
Together they give a more complete picture than either could alone.
Ptrace shows you that a write() happened with
O_DIRECT for 1 MB. eBPF shows you that the block
device took 5.2ms on average to complete those requests, and that
the process spent 102 microseconds waiting for the scheduler
between operations. That's the kind of visibility that helps us
understand both what our program does, and why it performs
the way it does.
github.com/louisboilard/compendium